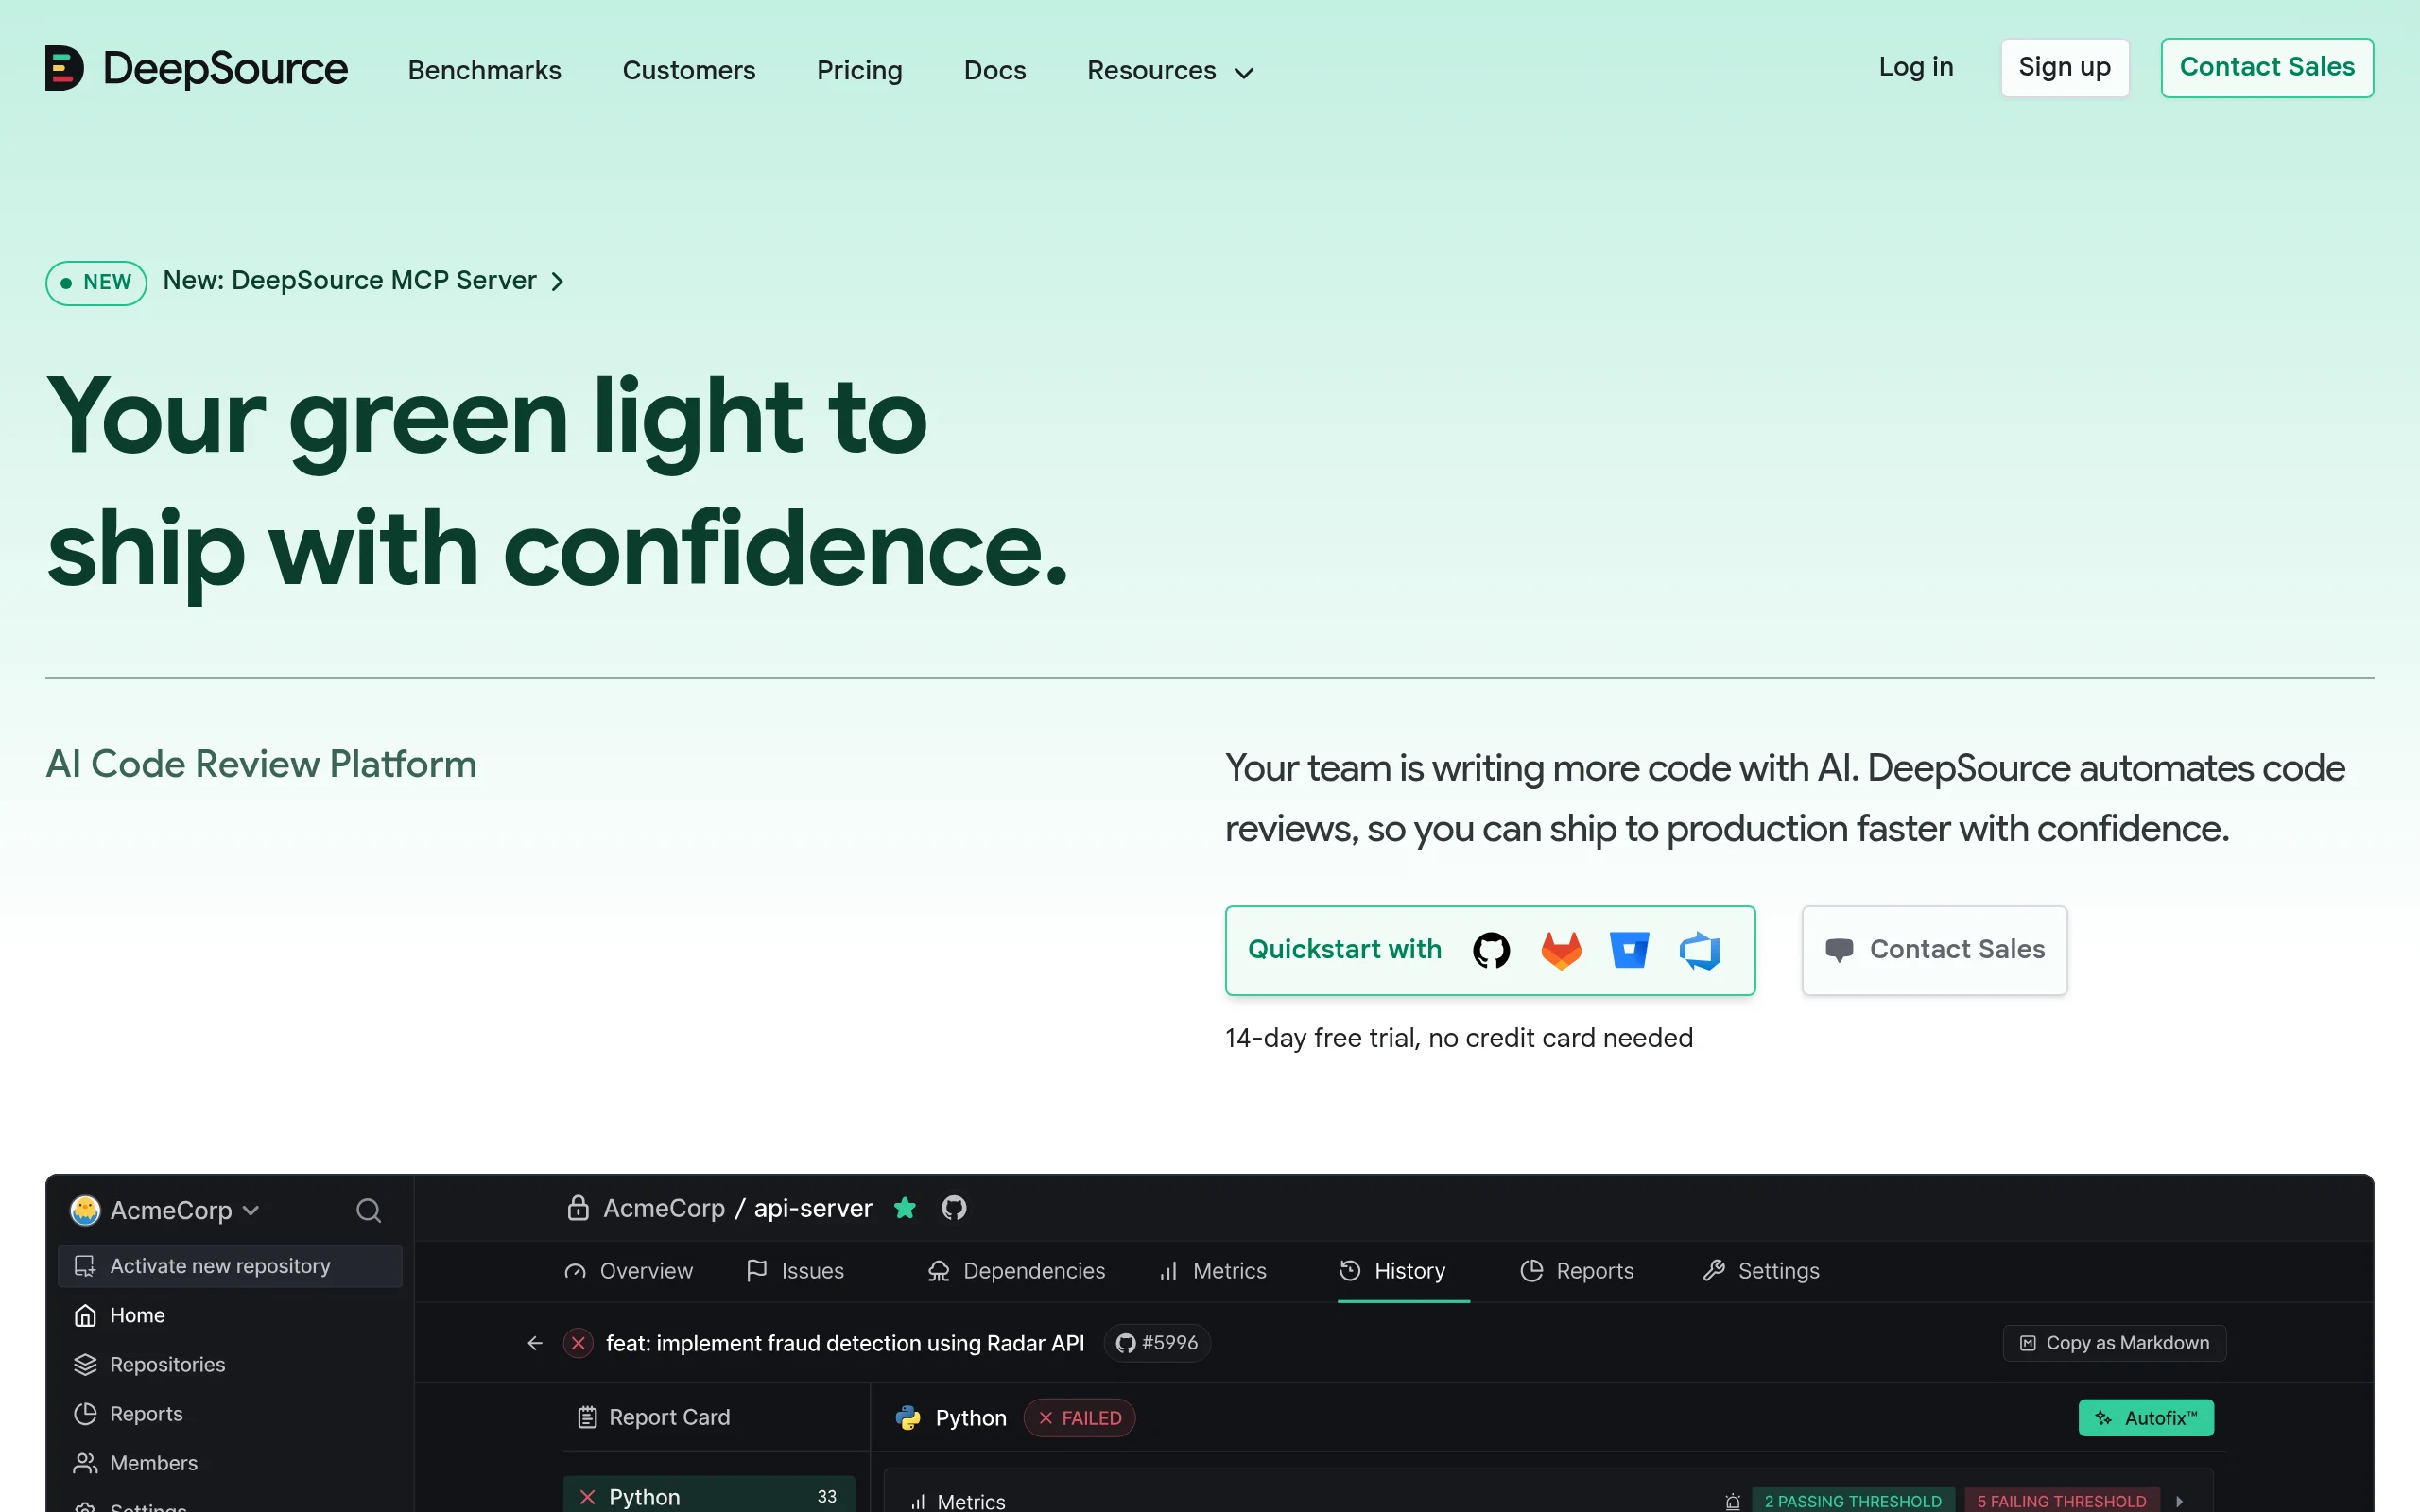
Introduction to DeepSource
In modern software development, code quality is paramount. Teams need to ensure that every pull request is free from bugs, security vulnerabilities, and anti-patterns before merging. This is where DeepSource comes in—an AI-powered code review platform that automates the tedious process of manual code inspection.
DeepSource acts as an intelligent, tireless reviewer that scans your codebase on every pull request. It detects issues ranging from simple style inconsistencies to complex security flaws, providing actionable feedback directly in your development workflow. Unlike traditional linters that only check surface-level formatting, DeepSource uses advanced static analysis and machine learning to understand the context of your code, making it far more effective at catching real problems.
The platform supports multiple programming languages including Python, Go, JavaScript, TypeScript, Ruby, Java, and Rust, making it versatile for polyglot teams. It integrates seamlessly with GitHub, GitLab, and Bitbucket, fitting naturally into existing CI/CD pipelines.
This tutorial will guide you through everything you need to know to get started with DeepSource, from initial setup to advanced configuration, ensuring you and your team can ship cleaner, safer code faster.
Getting Started with DeepSource
Creating Your Account
To begin using DeepSource, navigate to https://deepsource.com and click the “Sign Up” button. You can register using your GitHub, GitLab, or Bitbucket account—this is recommended as it simplifies the integration process. The free tier offers generous limits, including unlimited repositories for open-source projects, making it accessible for teams of all sizes.
Installing DeepSource on Your Repository
Once logged in, follow these steps to connect your first repository:
- Step 1: From your DeepSource dashboard, click “Add Repository”.
- Step 2: Select your Git provider (GitHub, GitLab, or Bitbucket). You may need to authorize DeepSource to access your repositories.
- Step 3: Choose the specific repository you want to analyze from the list.
- Step 4: DeepSource will automatically detect the primary programming language in your repository and suggest a default configuration.
- Step 5: Click “Analyze Repository” to trigger the first full scan of your codebase.
DeepSource will immediately begin analyzing your entire repository. This initial scan may take a few minutes depending on the size of your codebase. Once complete, you’ll see a comprehensive report of all issues found, organized by severity and category.
Understanding the Dashboard
The DeepSource dashboard is your central hub for monitoring code quality. Key sections include:
- Overview: Shows the overall health of your repositories, including issue counts and trends over time.
- Issues: A detailed list of all detected problems, filterable by severity (critical, major, minor), category (bug, security, style), and file location.
- Pull Requests: Displays the status of automated reviews on recent pull requests.
- Settings: Where you configure analyzers, ignore patterns, and integration settings.
Key Features of DeepSource
Automated Code Review on Every Pull Request
The core feature of DeepSource is its ability to automatically review every pull request (PR) opened in your repository. When a developer creates a new PR, DeepSource:
- Analyzes only the changed lines of code (incremental analysis).
- Compares the new code against existing issues in the base branch.
- Posts comments directly on the PR with specific line numbers and suggested fixes.
- Blocks the merge if critical issues are detected (configurable).
This ensures that no problematic code enters your main branch without being caught. Developers receive feedback instantly, allowing them to fix issues before the PR is reviewed by a human colleague.
Detection of Bugs, Anti-Patterns, and Security Issues
DeepSource goes far beyond simple linting. Its analysis engine is capable of detecting:
- Bugs: Logic errors, null pointer dereferences, infinite loops, incorrect API usage, and race conditions.
- Anti-patterns: Code smells like overly complex functions, duplicated code, deeply nested conditionals, and unused variables.
- Security Vulnerabilities: SQL injection risks, cross-site scripting (XSS), hardcoded credentials, insecure deserialization, and dependency vulnerabilities.
- Performance Issues: Inefficient loops, unnecessary database queries, memory leaks, and slow algorithms.
- Style Violations: Inconsistent indentation, naming convention breaches, and formatting issues based on community standards (PEP 8 for Python, ESLint for JavaScript, etc.).
Multi-Language Support
DeepSource supports a wide range of programming languages out of the box. Each language has dedicated analyzers optimized for its ecosystem:
- Python: Uses analyzers like Bandit for security, Pylint for style, and custom DeepSource analyzers for anti-patterns.
- Go: Leverages go vet, staticcheck, and custom checks for common Go mistakes.
- JavaScript/TypeScript: Integrates ESLint, TSLint, and Node.js security analyzers.
- Ruby: Uses RuboCop for style and Brakeman for security.
- Java: Employs SpotBugs and PMD for bug detection.
- Rust: Uses Clippy for linting and custom security checks.
Customizable Analysis Configurations
Every team has unique coding standards. DeepSource allows you to customize exactly what issues are detected and how they are reported. You can:
- Enable or disable specific analyzers for each language.
- Set severity thresholds (e.g., only block PRs for critical issues).
- Ignore specific files, directories, or code patterns (e.g., auto-generated code, test fixtures).
- Define custom rules using regex patterns or configuration files.
- Exclude known false positives to reduce noise.
Seamless Integration with Git Providers
DeepSource integrates deeply with your existing version control system. When connected to GitHub, GitLab, or Bitbucket, it:
- Automatically triggers analysis on new commits and PRs.
- Posts inline comments with issue details and fix suggestions.
- Updates PR status checks (pass/fail) based on analysis results.
- Provides a summary report within the PR conversation.
How to Use DeepSource: A Step-by-Step Guide
Step 1: Configure Your Project
After adding your repository, the next step is to configure how DeepSource analyzes your code. This is done by creating a .deepsource.toml file in the root of your repository. If you don’t create this file, DeepSource uses sensible defaults.
Here is a basic example for a Python project:
version = 1

[[analyzers]]
name = "python"
enabled = true

  [analyzers.meta]
  runtime_version = "3.11"

[[analyzers]]
name = "bandit"
enabled = true
This configuration enables the main Python analyzer and the Bandit security analyzer. You can add similar blocks for other languages. The .deepsource.toml file is version-controlled, so all team members use the same settings.
Step 2: Run Your First Full Analysis
Once configured, DeepSource will automatically run a full analysis of your entire codebase. You can view the results on the DeepSource dashboard under the “Issues” tab. Issues are categorized as:
- Critical: Immediate security vulnerabilities or logic errors that will cause crashes.
- Major: Significant code smells or potential bugs that should be fixed soon.
- Minor: Style violations or minor performance improvements.
Click on any issue to see the exact file and line number, along with a detailed explanation and suggested fix. Many issues include a “Fix” button that applies the suggested change directly to your code.
Step 3: Review Pull Requests
When a team member opens a new pull request, DeepSource automatically analyzes the changes. Here’s what happens:
- Status Check: A status check appears on the PR (e.g., “deepsource/analysis” with a pass or fail status).
- Inline Comments: DeepSource posts comments on specific lines where issues are detected. Each comment includes the severity, a description, and often a code suggestion.
- Summary Report: A summary is added to the PR conversation, listing all issues found, grouped by category.
- Blocking Merges: If your settings require it, PRs with critical issues cannot be merged until they are resolved.
Developers can respond to DeepSource comments by clicking “Resolve” if they believe the issue is a false positive, or by committing a fix. Once all issues are resolved, the status check turns green, and the PR can be merged.
Step 4: Use the DeepSource CLI (Optional)
For advanced users, DeepSource offers a command-line interface (CLI) that can be run locally. This is useful for:
- Running analysis before pushing code to the remote repository.
- Integrating DeepSource into custom CI/CD pipelines.
- Debugging analysis configurations.
To install the CLI, run:
curl -sSL https://deepsource.io/cli | sh
Then run analysis locally:
deepsource analyze
The CLI produces the same results as the cloud service, allowing you to catch issues before they reach the PR stage.
Step 5: Review and Improve Over Time
DeepSource is not a one-time setup. As your codebase evolves, you should regularly review the analysis results. Use the “Trends” section on the dashboard to see if the number of issues is increasing or decreasing over time. Set goals for your team, such as “reduce critical issues by 50% this quarter.”
You can also add “quality gates” that prevent merging if the number of issues exceeds a certain threshold. This encourages developers to fix issues immediately rather than accumulating technical debt.
Tips for Getting the Most Out of DeepSource
Start with Default Settings
When first using DeepSource, resist the temptation to customize everything immediately. The default settings are well-tuned for most projects. Run the initial full analysis, review the results, and only then start tweaking the configuration. This gives you a baseline understanding of what DeepSource catches and what you might want to adjust.
Use the Ignore Feature Wisely
Not all issues are actionable. Auto-generated code, third-party libraries, and test fixtures often produce false positives. Use the ignore configuration in your .deepsource.toml file to exclude these files. For example:
[ignore]
paths = [
  "vendor/**",
  "generated/*.py",
  "tests/fixtures/**"
]
This keeps your issue list clean and focused on code that your team actually maintains.
Educate Your Team
DeepSource is most effective when the entire team understands how to use it. Hold a brief training session to explain:
- How to read DeepSource comments on PRs.
- How to resolve false positives (by clicking “Resolve” or adding an inline comment).
- How to interpret severity levels (critical vs. minor).
- How to commit fixes directly from DeepSource suggestions.
Encourage developers to treat DeepSource as a helpful teammate, not a gatekeeper. The goal is to improve code quality, not to slow down development.
Integrate with Your CI/CD Pipeline
While DeepSource works out of the box with GitHub, GitLab, and Bitbucket, you can also integrate it into custom CI/CD pipelines using the DeepSource CLI. This is useful if you use self-hosted Git servers or have complex deployment workflows. Add the CLI step before your build and test stages to catch issues early.
Review False Positives Regularly
No static analysis tool is perfect. Occasionally, DeepSource will flag code that is actually correct (a false positive). When this happens, do not simply ignore it. Instead, add the specific pattern to your ignore list or adjust the analyzer configuration. This prevents the same false positive from appearing in future PRs, reducing noise for your team.
Leverage the Performance Suggestions
Many teams focus only on bugs and security issues, ignoring performance suggestions. However, these can have a significant impact on application speed and resource usage. Pay attention to DeepSource’s performance recommendations, such as optimizing database queries, reducing memory allocations, or using more efficient data structures. Over time, these small improvements compound into a much faster application.
Use the “Quality Trends” Dashboard
DeepSource provides a quality trends dashboard that shows how your codebase’s health changes over time. Review this dashboard weekly or monthly. If you see a spike in issues, investigate what changed. If you see a steady decline, celebrate with your team—it means your code quality practices are working.
Set Realistic Goals
Do not aim for zero issues on day one. Large codebases will have hundreds or thousands of issues initially. Instead, set incremental goals:
- Week 1: Fix all critical issues.
- Week 2: Fix all security issues.
- Week 3: Reduce major issues by 50%.
- Week 4: Establish a policy for handling minor issues.
This gradual approach prevents burnout and ensures sustainable improvement.
Customize Analyzers for Your Tech Stack
If your project uses specific frameworks or libraries, DeepSource may have specialized analyzers for them. For example, if you use Django in Python, enable the Django analyzer for framework-specific checks. If you use React in JavaScript, enable the React hooks analyzer. Check the DeepSource documentation for a full list of available analyzers.
Conclusion
DeepSource is a powerful ally in the quest for clean, secure, and performant code. By automating code review, it frees up developers to focus on what matters most: building features and solving problems. The platform’s ability to detect bugs, anti-patterns, security vulnerabilities, and style issues—all before human review—makes it an indispensable tool for modern development teams.
This tutorial has covered everything from initial setup to advanced configuration, giving you the knowledge needed to integrate DeepSource into your workflow effectively. Remember to start small, educate your team, and iterate on your configuration over time. With consistent use, DeepSource will help you ship better code faster, reduce technical debt, and ultimately build more reliable software.
Visit deepsource.com to create your account and start your first analysis today. Your future self—and your users—will thank you.

DeepSource: AI Code Review Platform
AI-powered static analysis and code review platform for developers.